Metric Graphing
You can launch the Metric Graphing window from the dashboard in both Contact Center Advisor (CCAdv) and Workforce Advisor (WA). Use the Metric Graphing window to monitor graphs for trends and to determine the effectiveness of actions taken to resolve specific situations.
Metrics must first be enabled for graphing in the Administration module. Only metrics and business objects to which you have access are displayed on the dashboard (see Role-Based Access and Permissions). An administrator configures settings that determine which combinations of metrics and time profile values can be stored and then graphed.
Important
If you set values for more than one time profile group for a metric, each counts as a separate metric for graphing. For example, if you set AHT to 10 minutes for the Short time profile group and AHT to 90 minutes for the Long time profile group, they appear as two metrics on the graph.Launching the Metric Graphing window
To launch the Metric Graphing window:
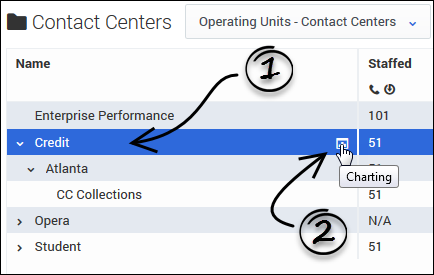
- Select a row in one of the following panes:
- Contact Centers pane (CCAdv or WA)
- Applications pane (CCAdv)
- Contact Groups pane (WA)
- The charting button displays in the selected row if an administrator has enabled metrics for that object and granted you permission to view the metrics associated with the object.
- If you see the charting button (
 ) in the selected row, click it to launch the Metric Graphing window.
Important
This feature is not available for agent groups.See also:
This page was last edited on July 5, 2018, at 23:00.
Comments or questions about this documentation? Contact us for support!

