Contents
DNA
DNA is where key business data, for example, quality monitoring, sales and revenue, customer satisfaction etc., has been used in creating a job role profile and the data is weighted in order of importance to the business.
This allows visibility of where there is a potential training requirement or where performance has exceeded expectation.
There may also be the opportunity for self-learning by assigning learning items to enhance performance based on the results achieved. As a manager you will have visibility of these performance results for your team and be able to assign learning items if required to individual team members.
My DNA
The My DNA page allows users to view their current scores for all assigned Strands. The data visualization supports drill-down.
Date Range
The data is shown for the selected date range, which defaults to the last week.
Data Visualization
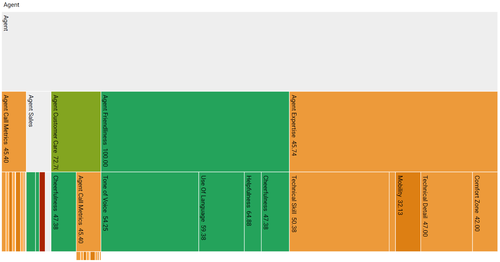
The performance data is displayed as a series of partition charts with the user’s assigned Strands at the top level.
Clicking on the different parts of the Strands will zoom to that node and allow deeper structures to be explored. The colors used are taken from the defined Thresholds.
The values shown are the raw scores for the current user aggregated over the selected date window.
Data Issues
Should there be any issues with the date returned these will be shown in expandable summaries above each Strand.
View Filtered DNA
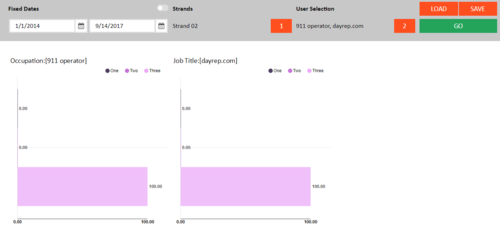
The View Filtered DNA page shows user performance for Strands and User Demographics where users fall into each threshold band. Initially it shows a chart for each User Demographic, then for each strand selected. The chart(s) display the percentages of users within each threshold band.
Date Range
The data is filtered by a start and end date which can be selected using fixed dates or calculated as rolling dates. Use the button in the top right corner to toggle between the selections. Rolling dates are calculated from the previous day minus the values selected in the dropdowns.
Strand Selector
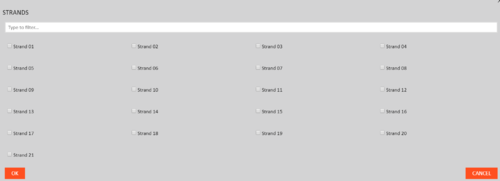
Select Strand(s) by clicking the orange button beneath Strands and selecting the relevant strands from the modal and clicking ‘OK’, clicking ‘CANCEL’ will remove all selections you have made. A maximum of 10 strands can be selected, if more than 10 are selected it will disable the ‘OK’ button.
User Selection
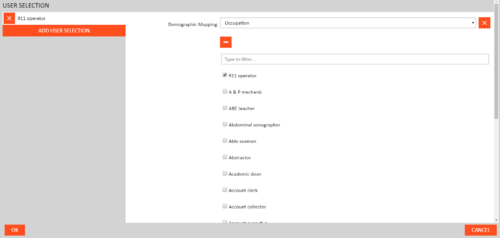
The User Selection filter allows a user to select one or more user demographics for comparison. The initial filter displays summary text and a count of any currently selected demographics. Clicking the count button will open a more detailed view of the filter for editing.
The left-hand side of the dialog displays each demographic grouping that can be removed or added to using the Cross and Add User Selection buttons respectively.
The right-hand side of the dialog displays the currently highlighted demographic grouping. Each grouping consists of a Percentile Range and zero or more Demographic Mappings.
The Demographic Mappings can be chosen using the dropdown as well as being removed and added to using the Cross and ADD FILTER button respectively. Any selected values will be displayed at the top followed by the top 20 unselected values. The unselected values can be filtered using the textbox at the top of each result set. Additional data will only be retrieved from the server after 3 or more characters have been inputted into the filter textbox.
Loading and Saving Filters
Filters can be saved and set as a default for future use. A default filter will be automatically loaded when the page loads and only one filter can be set as a default per page. The loading and saving dialogs can accessed by selecting the LOAD and SAVE buttons.
The Load Filter dialog allows a user to select any of their saved filters for the current page. A filter can be loaded by selecting it from the dropdown and clicking the OK button. If Make this my default is checked then this will also make the selected filter the default for the page.
The Save Filter dialog allows a user to save a new filter or edit an existing one. Each filters name must be unique and if a filter with is saved using an existing filters name then it will replace it. If Make this my default is checked then this will also make the selected filter the default for the page.
Once all your filters have been selected, click ‘GO’ to get the threshold band chart(s).
Data Visualization
The charts below show users grouped into the relevant threshold bands for their aggregated BDD/Calculated results per Strand/Demographic. Clicking the colored circles in the top right corner of each chart will toggle that bar for that chart on and off.
Threshold Band Data
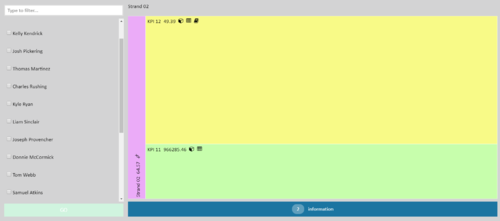
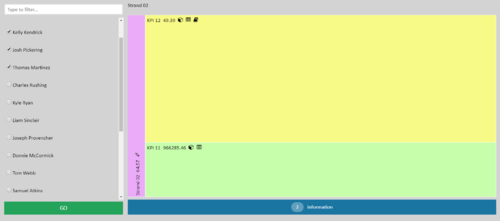
To see the data for a given bar you can click a bar within a single chart and it will bring up the filtered detail window to show all data for that threshold band. You can then see the individual breakdowns within the partition chart and a list of users to filter by.
You can reduce the number of users shown by searching for a user(s) by searching for them via the filter box.
Assign Users to Learning Item(s)
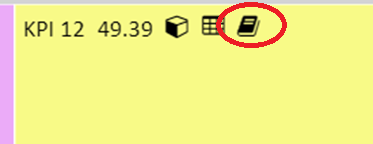
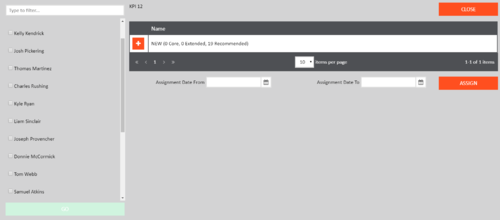
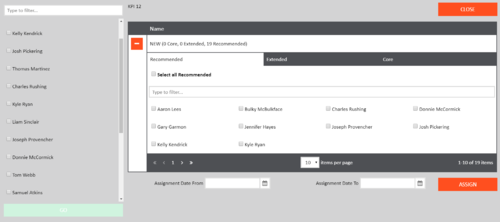
Clicking on the book icon (furthest right in the icon list) will show the Learning Item Assignments grid.
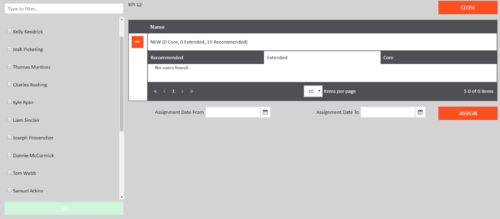
Clicking the + button expands the grid to show the users for each learning based on Recommended, Core or Extended.
Clicking ‘CLOSE’ at any stage will return to the partition chart cancelling any existing selections made. Users can be found within the individual tabs for each recommendation type and results are paged per tab, the number of results can be adjusted by changing items per page.
Selecting users from within a tab and then switching to another will remember your options. This is so that users can be selected for all recommendation types, for all returned learning items and assigned in bulk. Once all users have been selected for assignment, select the assignment from and to date and click ‘Assign’.
If the assign is successful it will close the Learning Item Assignment and return to the partition chart and all users selected will be placed in the assignment queue.

