Monitoring
If you have installed the Observability Solution following Installing Observability, you would have access to dashboards designed specifically for Genesys Web Services (GWS) 8.6.
This article provides detailed screenshots of dashboards for different metrics.
Dashboards
Node Exporter full
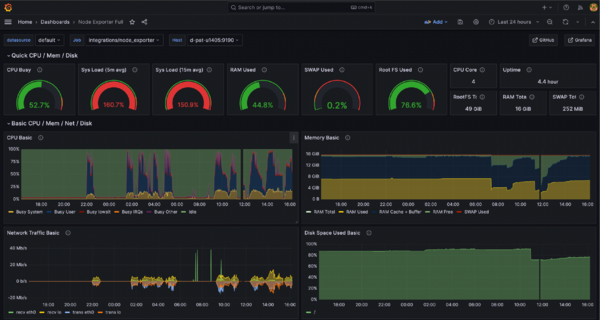
The following screenshot displays the infrastructure/OS-level dashboard which describes system level metrics, for example, CPU, memory, and network.
GWS overview
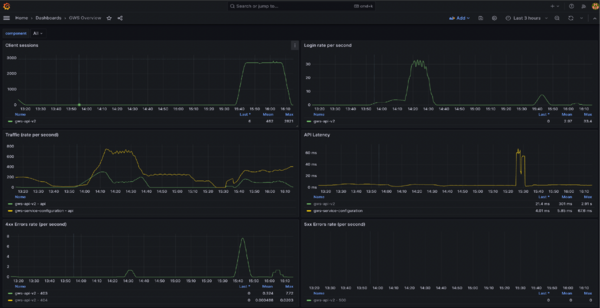
The following screenshot displays the GWS 8.6 Application Overview dashboard which describes GWS 8.6 specific performance and application metrics.
GWS instances
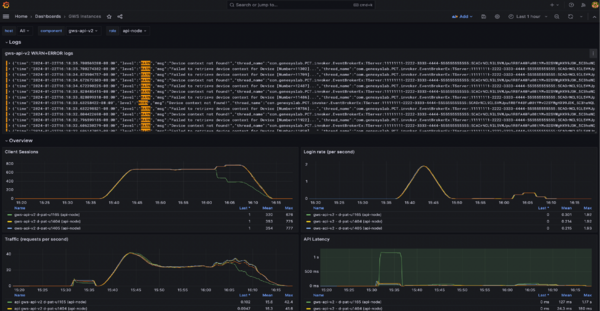
The following screenshot displays the detailed GWS 8.6 Application dashboard which contains an in depth GWS 8.6 telemetry based on both logs and metrics.
Note: Additional optional dashboards are available for Datastores such as Redis and ElasticSearch and they are provided in the installation package.
Explore mode
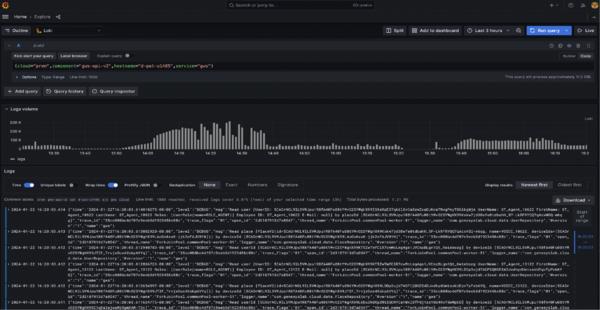
By clicking the Explore Mode button, users can leverage the power of both log and metrics query languages (LogQL and PromQL) to create their own custom telemetry requests.
Data Export and Import Process
This is a feature included in the installation package which allows you to transmit telemetry data to Genesys on need basis in case Genesys support requires it.
Note that the Export and Import feature does not redact sensitive data. To use this feature, follow the instructions given as part of the Observability installation package here: OBS_instance/import_export_scripts/README.md


