Performance Comparison of Physical Server and Virtual Machines
Single Hex Core
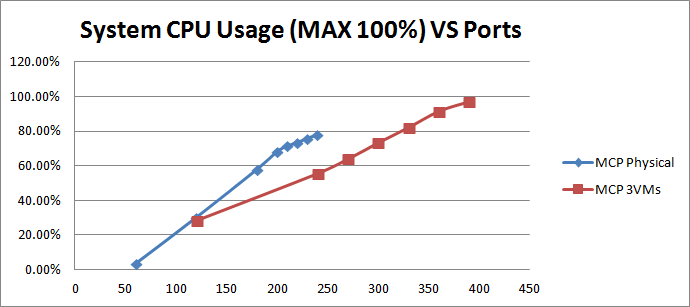
With a single hex core CPU, Genesys recommends 200 ports as a reasonable peak port capacity on a physical server with a single X5670, assuming that all criteria have been met. 300 ports can be achieved with a three-VMs configuration of the same hardware, with a single X5675 (performance is slightly better than X5670). The graph below compares overall CPU usage:
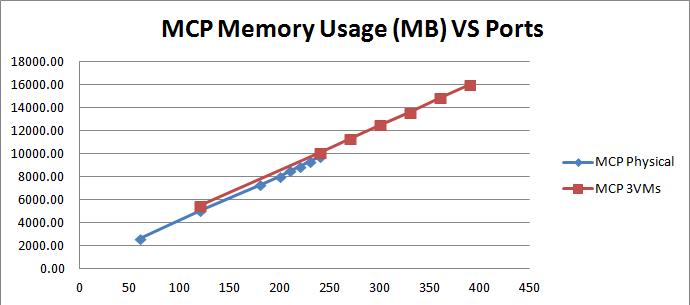
Memory usage for MCP scales linearly against port capacity:
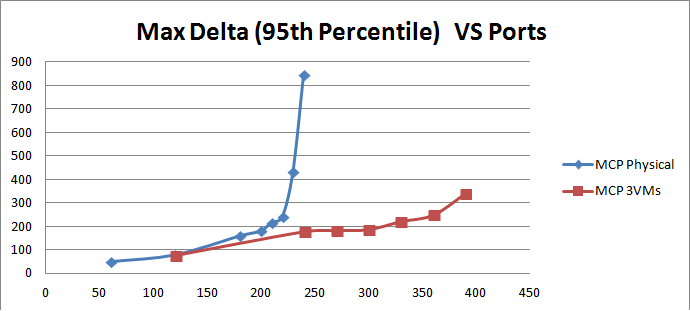
The two graphs below compare the 95th percentile value of Max Jitter Buffer and Max Delta, tracking audio quality from a sample RTP stream:
A strong correlation exists between Max Jitter Buffer and Max Delta, regarding audio quality. A physical server can meet all criteria when its port capacity is 200 or below. Port capacity that is between 200 and 220 may impact audio quality, since both Max Jitter buffer and Max Delta are just slightly beyond the passing criteria. You can consider 220 as peak performance, if audio quality is not strictly required and can be waived. However, when port capacity reaches 230 or beyond, the two values become so big that there is apparent audio quality impact.
For VM configuration: Preferred/Recommended = 300 ports; Peak Port Capacity = 360 ports. With 390 ports, overall system CPU usage is 97%, close enough to 100% that it also observed audio quality impact.
Below are two tables of IOPS for the above two configurations:
Table 1: Disk IOPS of system level from a physical server with a single hex core
| Ports | Disk IOPS Physical Server | ||
|---|---|---|---|
| Total | Reads | Writes | |
| 60 | 11.13 | 0.001 | 11.13 |
| 120 | 21.82 | 0.001 | 21.82 |
| 180 | 32.03 | 0.001 | 32.03 |
| 200 | 34.95 | 0.001 | 34.95 |
| 210 | 36.53 | 0.001 | 36.53 |
| 220 | 37.76 | 0.001 | 37.76 |
| 230 | 39.48 | 0.001 | 39.48 |
| 240 | 43.33 | 0.002 | 43.33 |
Table 2: Disk IOPS of sum of all VMs of single hex core
| Ports | Disk IOPS VMs Overall | ||
|---|---|---|---|
| Total | Reads | Writes | |
| 120 | 20.68 | 0.101 | 20.58 |
| 240 | 36.29 | 0.070 | 36.22 |
| 270 | 41.39 | 0.087 | 41.30 |
| 300 | 45.57 | 0.065 | 45.50 |
| 330 | 48.85 | 0.000 | 48.85 |
| 360 | 51.69 | 0.000 | 51.69 |
| 390 | 57.82 | 0.002 | 57.82 |
Disk IOPS in Disk IOPS of sum of all VMs of single hex core table is the sum of Disk IOPS from all VMs. Also, IOPS is measured from each VM and then totaled, to determine overall IOPS. The same method is applied to all Disk IO calculations for VM environments in this series of tests.
Also in the above two tables, the IOPS Reads value is quite small because most of the operations are Writes.
The graph below compares the two IOPS tables above:
- System level disk IOPS is scaling linearly against port capacity for both physical server and virtual machines.
- SSD is only used on VM env as cache folder of MCP recording while SAS HDD drive is used to installed OS and MCP.
Dual Hex Cores
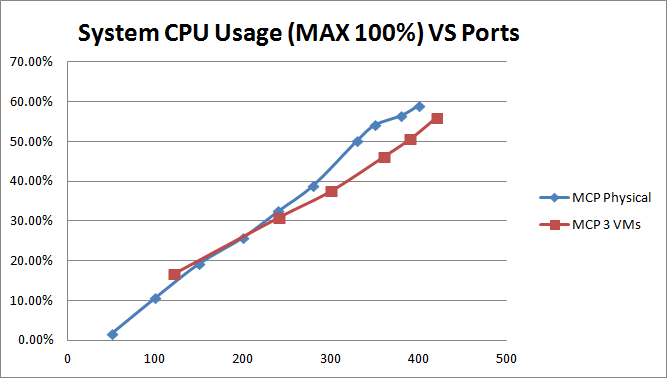
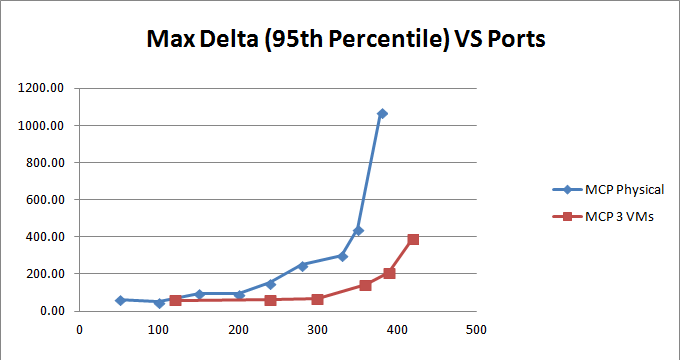
With a host of dual hex core CPUs (2x X5675@3.06GHz) with 32 GB RAM, we also compare the results from physical server and VM env. In VM env, on same hardware spec, 3 VMs are configured with 4 vCPU and 8 GB RAM assigned to each VM. Only one MCP installed on each VM and a SSD partition is used as cache folder for MCP recording.
The graph below depicts the overall system CPU usage:
The next two graphs show 95 percentile values of Max Jitter and Max Delta from sample RTP stream quality analysis:
The two tables below show:
- Disk IOPS at system level on a physical server.
and - Disk IOPS at system level on a VM environment.
Table 3: Disk IOPS at system level from physical server of dual hex cores
| Ports | Disk IOPS Physical Server | ||
|---|---|---|---|
| Total | Reads | Writes | |
| 50 | 9.069 | 0.000 | 9.07 |
| 100 | 18.587 | 0.000 | 18.59 |
| 150 | 28.598 | 0.001 | 28.60 |
| 200 | 37.460 | 0.001 | 37.46 |
| 240 | 41.290 | 0.003 | 41.29 |
| 280 | 49.031 | 0.020 | 49.01 |
| 330 | 53.373 | 0.001 | 53.37 |
| 350 | 53.150 | 0.001 | 53.15 |
| 380 | 61.456 | 0.001 | 61.46 |
| 400 | 64.123 | 0.001 | 64.12 |
Table 4: Disk IOPS of sum of all 3 VMs of dual hex cores
| Ports | Overall Disk IOPS | ||
|---|---|---|---|
| Total | Reads | Writes | |
| 120 | 22.38 | 0.024 | 22.35 |
| 240 | 38.99 | 0.012 | 38.97 |
| 300 | 48.60 | 0.017 | 48.59 |
| 360 | 56.05 | 0.047 | 56.00 |
| 390 | 60.24 | 0.002 | 60.24 |
| 420 | 64.59 | 0.028 | 64.57 |
The graph below compares the above two tables above:
- Comparing the figure Comparison of System Disk IOPS Physical Server and VM from Single Hex Core and Comparison of System Disk IOPS Physical Server and VM from Dual Hex Cores: IOPS is linearly related to ports. No big differences exist between the physical server and the VM environment.
- SSD is used only in VM environments, as the cache folder of MCP recordings, while an SAS HDD drive is used to install the OS and MCP.

