MP3 16 kbps Bit Rate with Encryption
We tested the MP3 16 kbps bit rate with encryption, using the dest2 physical server and Vitual Machine (VM) environments, which compares with results of non-encryption from MP3 16 kbps Bit Rate without Encryption. The OS remained Windows 2008 R2 x64.
Physical Server on Single Hex Core
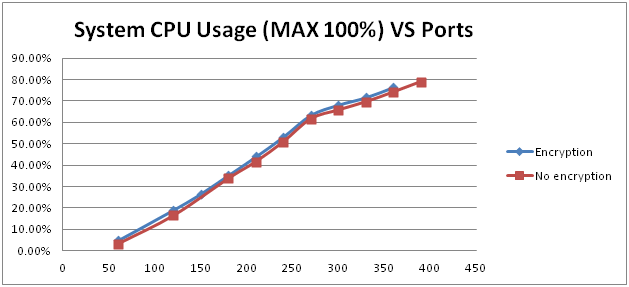
These tests were performed on Hardware Profile 1: a physical server on a single hex core of Dell R410. The three graphs below compare system CPU usage and audio quality-related metrics, max jitter and max delta.
In the graphs above, encryption consumes slightly higher system CPU than does non-encryption. Max Jitter and Max Delta consume much more CPU with encryption, than without. If a slightly higher delay due to latency introduced by encryption is acceptable, then recommended and preferred port capacity would be 210 ports—only a 12.5% reduction from the peak capacity of 240 ports offered by non-encryption. If the audio quality strictly applies, then the recommended port capacity can be as low as 120 ports. Peak port capacity could be the same 270 ports as non-encryption, if the delay is acceptable.
The table below lists system disk IOPS:
Figure 60: IOPS on physical server of single hex core, MP3 only, 16 Kbps, encryption
| Ports | Physical Server Disk IOPS | ||
|---|---|---|---|
| Total | Reads | Writes | |
| 60 | 14.66 | 0.036 | 14.62 |
| 120 | 24.00 | 0.041 | 23.95 |
| 180 | 33.42 | 0.029 | 33.39 |
| 210 | 37.65 | 0.030 | 37.62 |
| 240 | 42.21 | 0.029 | 42.18 |
| 270 | 47.18 | 0.036 | 47.14 |
| 300 | 51.44 | 0.011 | 51.43 |
| 330 | 55.81 | 0.006 | 55.81 |
| 360 | 60.99 | 0.002 | 60.99 |
| 390 | 67.12 | 0.003 | 67.11 |
The graph below compares system disk IOPS on a physical server IOPS with non-encryption:
System disk IOPS is nearly the same for encryption and non-encryption; both increase slightly at a higher port capacity. Some of that can be attributed by other disk IO operations, such as encryption key files.
The table below lists MCP IOPS:
Figure 62: MCP IOPS on physical server of single hex core, MP3 only, 16 Kbps, encryption
| Ports | Physical Server MCP IOPS | ||
|---|---|---|---|
| Total | Reads | Writes | |
| 60 | 16.53 | 8.88 | 7.65 |
| 120 | 32.59 | 17.69 | 14.91 |
| 150 | 40.40 | 21.96 | 18.44 |
| 180 | 48.46 | 26.46 | 22.01 |
| 210 | 56.35 | 30.83 | 25.52 |
| 240 | 64.32 | 35.24 | 29.08 |
| 270 | 72.28 | 39.64 | 32.64 |
| 300 | 80.06 | 43.95 | 36.11 |
| 330 | 88.61 | 48.53 | 40.07 |
| 360 | 100.48 | 52.91 | 47.57 |
The graph below compares total MCP IOPS between encryption and non-encryption:
MCP IOPS for encryption increases when port capacity increases. As seen in Figure: Comparison of System Disk IOPS on Single Hex Core Physical Server, MP3 16kbps encryption vs non-encryption, increase for disk IOPS is much smaller for encryption, so here the increase should be attributed to network IOs.
VMs on Dual Hex Cores Server
The testing for MP3 16kbps with encryption was conducted on the VM Profile 4 based on Hardware Profile 4 of a dual hex cores server, same as non-encryption in the 16knps tests VMs on Dual Hex Cores Server. Six VMs were configured while only one MCP was installed on each Windows VM. Below are three graphs comparing overall CPU usage, audio quality related max jitter and max delta for MP3 16kbps encryption vs non-encryption:
The VM environment exhibits a similar trend: slightly overall CPU usage for the encryption profile, and much higher for max jitter and max delta. Applying the same criteria from the physical server results, if a slightly higher delay (due to latency introduced by encryption) is acceptable, then the recommended and preferred port capacity could be 600 ports—only a 16.7% reduction of the peak 720 ports with non-encryption. If audio quality strictly applies, the recommended ports can be as low as 480 ports. And if some delay is acceptable, then the peak port capacity can be the same 840 ports as non-encryption.
The overall system disk IOPS for all 6 VMs is listed below:
Figure 67: Overall Disk IOPS on all 6 VMs of dual hex cores, MP3 only, 16 Kbps, encryption
| Ports | Overall 6 VMs Disk IOPS | SSD Drive Disk IOPS | ||||
|---|---|---|---|---|---|---|
| Total | Reads | Writes | Total | Reads | Writes | |
| 120 | 28.70 | 0.004 | 28.69 | 21.881 | 0.000 | 21.881 |
| 360 | 67.46 | 0.004 | 67.46 | 56.238 | 0.000 | 56.238 |
| 480 | 87.56 | 0.026 | 87.54 | 74.903 | 0.000 | 74.903 |
| 600 | 108.01 | 0.015 | 107.99 | 93.647 | 0.000 | 93.647 |
| 660 | 119.49 | 0.005 | 119.48 | 104.304 | 0.000 | 104.304 |
| 720 | 128.76 | 0.020 | 128.74 | 114.441 | 0.000 | 114.441 |
| 780 | 137.68 | 0.015 | 137.66 | 123.210 | 0.002 | 123.209 |
| 840 | 146.99 | 0.009 | 146.98 | 132.646 | 0.002 | 132.644 |
| 900 | 154.68 | 0.025 | 154.66 | 140.145 | 0.002 | 140.143 |
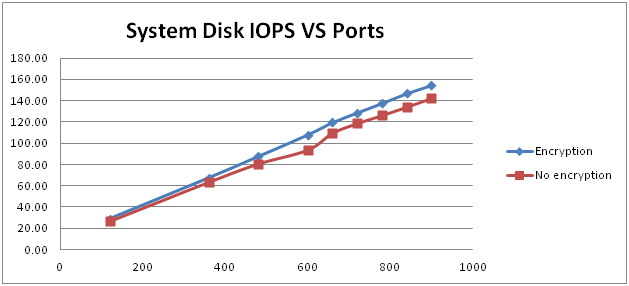
The graph below compares system disk IOPS with encryption and with non-encryption, on the same VM environment:
As with the physical server tests, encryption increases as port capacity increases. Also as with the physical server tests, some of that can be attributed to extra disk IO operations.
The table below lists Data throughputs for encryption:
Figure 69: Data Throughputs for MP3 only, 16 kbps, encryption
| Ports | Overall Disk KB/sec | SSD Drive Disk KB/sec | ||||
|---|---|---|---|---|---|---|
| Total | Reads | Writes | Total | Reads | Writes | |
| 120 | 387.99 | 0.02 | 387.97 | 304.229 | 0.000 | 304.229 |
| 360 | 1096.82 | 22.54 | 1074.28 | 876.599 | 0.000 | 876.599 |
| 480 | 1344.60 | 107.95 | 1236.65 | 1191.403 | 0.006 | 1191.397 |
| 600 | 2187.50 | 348.40 | 1839.09 | 1532.171 | 0.000 | 1532.171 |
| 660 | 2024.16 | 35.09 | 1989.07 | 1652.232 | 0.000 | 1652.232 |
| 720 | 1955.33 | 99.81 | 1855.51 | 1803.207 | 0.006 | 1803.201 |
| 780 | 2572.79 | 205.15 | 2367.64 | 1982.733 | 0.024 | 1982.709 |
| 840 | 2534.97 | 28.65 | 2506.32 | 2097.871 | 0.043 | 2097.829 |
| 900 | 2851.85 | 119.47 | 2732.38 | 2297.264 | 0.007 | 2297.257 |
Using Formula 1...
MP3 bitrate * Ports / 8 = KB/sec
Or 16kbps * Ports / 8 =KB/sec if MP3 is 16kbps
...take two samples (120 & 720) from the above table above, and apply them to Formula 1:
16 kpbs * 120 / 8 = 240 kb close to 304 in the table (in SSD)
16 kpbs * 720 / 8 = 14400 kb close to 1803 in the table (in SSD)
The measurements from real testing for MP3 16kbps encryption are slightly higher than these calculations predict, due to other file, such as metadata and JSON files, being saved on the same cache folder.
The graph below compares overall data throughputs with no encryption:
The data throughputs for encryption increase slightly when port capacity increases, matching a similar trend with system disk IOPS.
The table below lists overall MCP IOPS from all 6 VMs:
Figure 71: Overall MCP IOPS from 6 VMs of dual hex core, MP3 only, 16kbps, encryption
| Ports | Overall 6 VMs MCP IOPS | ||
|---|---|---|---|
| Total | Reads | Writes | |
| 120 | 34.874 | 17.638 | 17.236 |
| 360 | 102.624 | 52.900 | 49.724 |
| 480 | 130.285 | 70.377 | 59.909 |
| 600 | 168.849 | 87.766 | 81.083 |
| 660 | 186.175 | 96.882 | 89.293 |
| 720 | 193.248 | 105.171 | 88.077 |
| 780 | 219.395 | 114.398 | 104.997 |
| 840 | 235.730 | 123.009 | 112.720 |
| 900 | 252.198 | 131.682 | 120.516 |
The graph below compares performance of the same configuration, except with non-encryption:
MCP IOPS performance is affected slightly by encryption, similar to the trend expressed in the physical server results.


