
How do I generate real-time reports using Genesys Pulse?
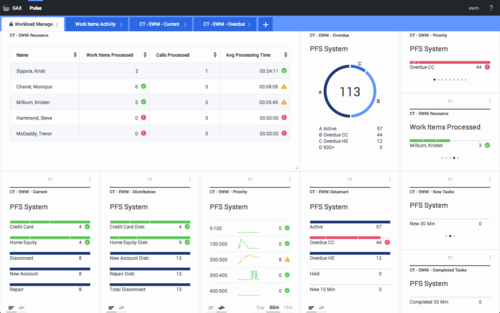
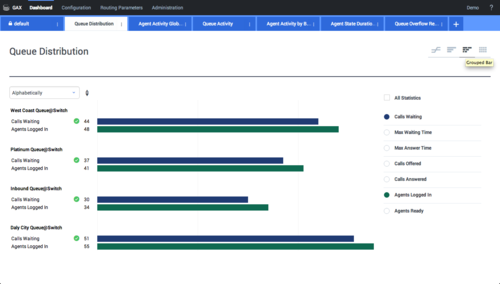
Genesys Pulse is a Genesys Administrator Extension (GAX) plug-in application that enables at-a-glance views of real-time contact center statistics within the GAX graphical user interface. On the Genesys Pulse dashboard, widgets display user-defined Donut, Grid, Key Performance Indicator (KPI), or List charts of statistics for objects. You can view and select additional details and options by expanding a widget. Once maximized, you can choose a Stacked Bar, Grouped Bar, Grid or Line Chart view. You can also sort the data, select which objects to include, and edit the widget.
Contents
How do I access Genesys Pulse real-time reports?

You can open the Pulse dashboard within Genesys Administrator Extension (GAX) to see the real-time reports. Reports are displayed in widgets, which can easily be expanded to dashboard size to display additional detail.
Genesys Pulse provides a default dashboard the first time you use Genesys Pulse. Dashboards are managed by using tabs. Click on the more icon in the right corner of the dashboard for options:
- Rename Tab—Change the name of the Genesys Pulse Dashboard tab.
- Add a Widget—Add a new widget to the dashboard.
- Reset to Default Dashboard—Deletes all widgets and resets to the default dashboard.
- Set as Default Dashboard—Set the dashboard to be the default. Available to users with full privileges.
- Delete—Deletes the dashboard.
Genesys Pulse Dashboard Examples
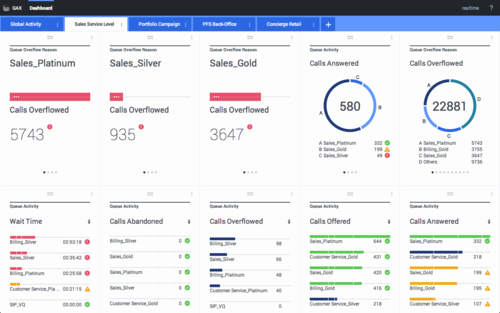
[+] Sales service level dashboard for a supervisor
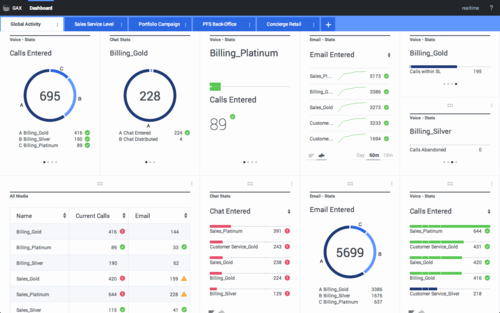
[+] Multi-channel dashboard for a supervisor
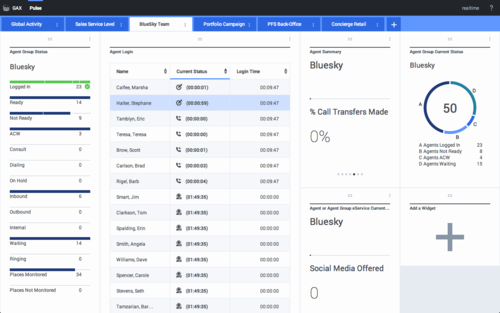
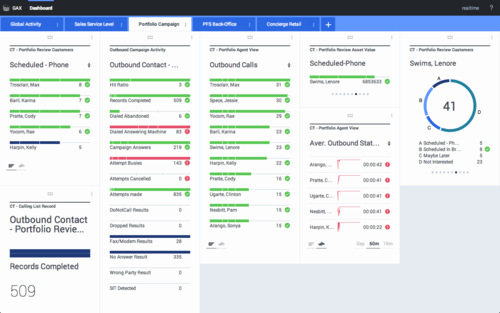
[+] User-defined dashboard for a supervisor
How do I use the report widgets on my dashboard?

Genesys Pulse widgets display Donut, Grid, Key Performance Indicator (KPI), Line, or List charts of key statistics for objects on your dashboard.
You can add new widgets to your dashboard.
You can perform the following actions on a widget:
- Clone
- Delete
- Edit
- Expand
How do I download report data?
You can save the report data from an expanded widget as a CSV file. Click the more icon in the top right corner of an expanded widget and select Download widget.
How can I expand a report to fill the dashboard?

Click on the more icon in the top right corner of a widget and select Expand to Tab to see a detailed view of your report.
There are four chart types available in the expanded widget:
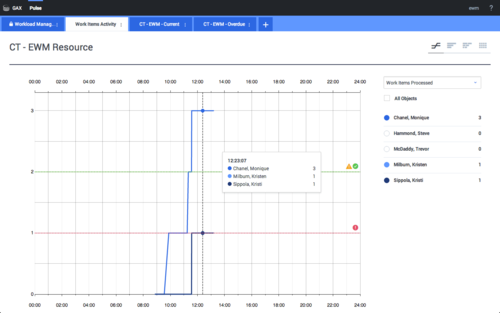
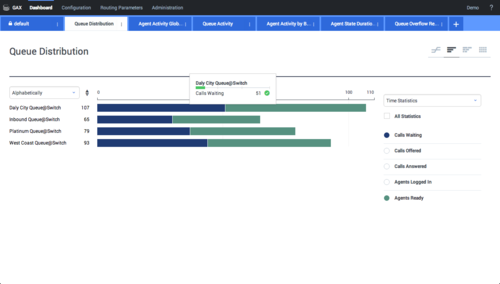
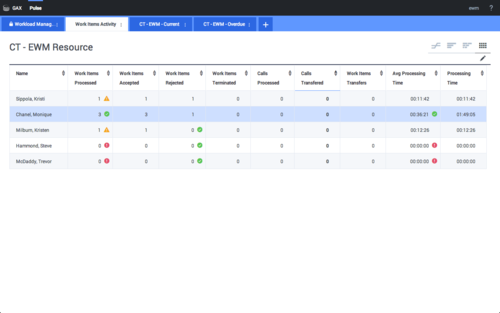
This expanded report opens within a new tab, so you won't impact your initial dashboard. You can rename your new tab by clicking on the more icon in the top right corner of the tab and select Rename Tab. From here, you can use sort options, define objects, and define statistics. Click the pencil icon to change the number of columns for the Grid.