How can I use templates to simplify widget creation?
Did you know that you can create and use Pulse templates to simplify widget creation? Any users with the appropriate privileges can create or modify templates. You can then create various widgets using your template.
The easiest way to create a template is to clone and edit an existing template within Pulse. Pulse provides a basic set of predefined templates, complete with statistics that are typical for reporting activities handled by Genesys solutions. Any users with the appropriate privileges can create or modify the available templates.
Contents
How do I Add, Clone, or Edit a template?
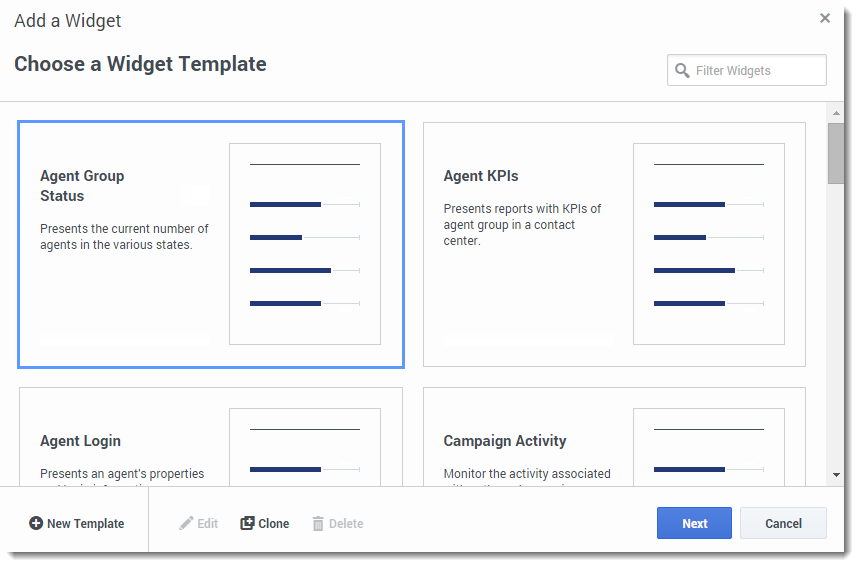
The template wizard guides you through the process of creating, changing, and deleting templates. To open the template wizard, click Add Widget and select New Template. The Choose a Widget screen displays an alphabetical list of Pulse templates.
To create a Pulse template, you must add or configure:
- One or more object types.
- One or more statistics.
- One widget type with specific options to display the information.
What template details do I need?
On the Details screen, you:
- Define the name of the new template
- Describe the scope of this template
- Select one or more object types from the selection based on what you might want to monitor.
Pulse allows you to select objects that are compatible with your template. For example:
- The Agent KPI template includes the Agent, Agent Group, Place, and Place Group objects.
- The Agent Group Status template includes the Agent Group and Place Group objects.
How do I select statistics?
Within the Pulse statistic definition, you can specify statistic parameters regardless of whether or not they are available on any StatServer in your environment. This means you must also update the StatServer options to ensure that the StatServer connected to Pulse contain the corresponding options (for example, statistic types and filters).
You must add at least one non-string statistic.
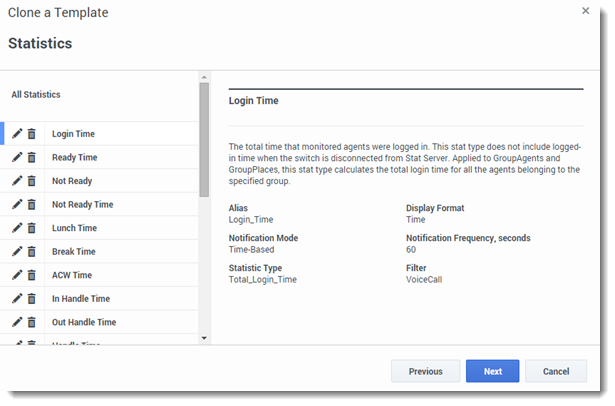
Choose the statistics and properties to include in your template. Pulse statistics are described in detail in the templates.xls file.
Pulse displays statistic details when you select a statistic. This information includes the components of the stat type definition and other parameters that form the request that Pulse sends to Stat Server. You can modify a statistic definition within Pulse when you create, clone, or edit a template.
How do I define the display options?
The final step before validating your template is to define what should be the default display of your widget on the main dashboard. This setting is the one displayed to Pulse users, but they can then modify the widget options on their own dashboard.
- Name the widget title
- Select the Widget Type to display.
Note: The maximum value for the bar charts in List and KPI widgets is the maximum value of all the objects selected for the statistic in this widget or maximum value of the alert configured for this widget.
- Select the Widget refresh rate.
- Select options associated with the visualization (for example, thresholds and size).
- Optional: For templates configured to use changes-based statistics (CurrentStatus and ExtendedCurrentState), set enable quick updates. See Deploying RabbitMQ for Quick Widget Updates.
- If needed, select the statistics for alerts and define the alert values (from 1 to 3).


