Sizing Calculator
Before deploying Context Services (CS) for your Conversation Manager solution, you must estimate the size of solution that will be able to handle the expected user load. Genesys recommends that you download the CS Storage Sizing Calculator, an Excel spreadsheet that you can use to help calculate the number of Context Services nodes required for your production deployment.
| CS Storage Sizing Calculator |
|---|
| CS-StorageSizing.xlsx |
Using the Sizing Calculator Spreadsheet
To use the sizing calculator, The following information is required:
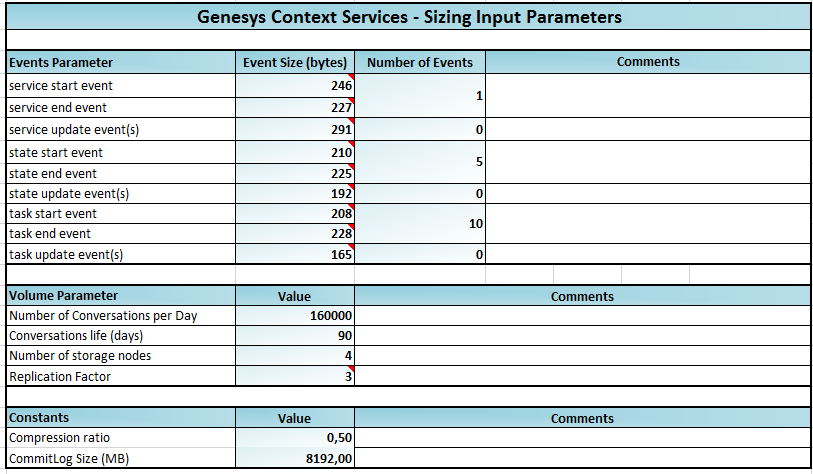
- Approximate event size in bytes for event start/end/update of service/state/task (including extension data). You can extract this information from the JSON of the events.
- Number of update events per services/states/tasks
- Number of states/tasks per service
- Number of Cassandra nodes and replication factor
- Retention policy in days and number of conversation per day
The sizing calculator takes into account Cassandra storage specifics such as Replication Factor (storage size is multiplied by 3 as default replication), compression (ratio is estimated to 0.40 by default), and compaction overhead which requires more storage during cycles of data re-organization by Cassandra.
Input Example
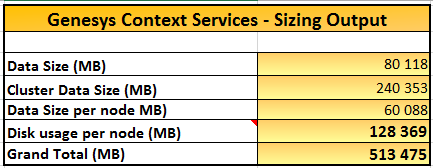
Output Example
Example of Hardware Sizing
This example shows an initial GMS and CS cluster deployment and ensures that performance is correct in scale.
In this example, GMS and CS 8.5.003.00 and later instance is used with external Cassandra 2.0.8.
| Host | Specifications | Software Components |
|---|---|---|
| 4 similar hosts | Windows Server 2008 R2 Standard SP 1 Intel Xeon X3440 @ 2.53 GHz, quad core |
JMeter 2.11 GMS 8.5.003.00 and later |
| Genesys Framework | Windows Server 2008 R2 Standard SP1 | Runs Genesys Framework/Suite 8:
|
GMS and CS are configured to handle a constant average CPU of 50%. This allows for burst and Cassandra background activities to happen correctly, high load prevent cleaning to occur correctly, and increasing
latencies over time.
Configuration
Start from a database with 2.5GB data on each node. Complex statistics (requiring fetch of "start" event during processing of "end" event) are enabled for States/Tasks. All statistics are available for Services.
Special settings and enhancements:
- Cassandra 2.0.8
- Replication Factor = 2
- Consistency Level = 1/1 (read/write)
- Correctly Balanced Cassandra node tokens for each node to own 25% data
Options:
- cview/data-validation=false
JMeter:
- Modified to add constant time between events (200ms), allowing constant load of GMS nodes
Results
| Captured measure | Value | Comments |
|---|---|---|
| Database size | 68 GB / node (after 120h+ run by set of 48h) = 272 GB | 272 GB corresponds to 16.5 M conversations or 264 M activities that make a ratio of 0.54KB for each activity. Multiply by replication factor to reflect correct disk size. |
| Throughput | Approximately1000 tx/s (approximately 30.5 scenario/s) | Constant through 24h testing |
| Size of conversation | Approximately10kB in JSON | This matches a conversation of 16 activities, with extension data as returned by Query Service, State, and Tasks by CustomerId |
| CPU | Approximately 20% to 60% | Each node was around an average of 30% with peaks to 60% from time to time |
| Memory | 2.4GB | For each GMS process, less than 2 GB for Cassandra processes. |
| I/O Disc | Approximately 3 MB/s (Cassandra measure) | Disk I/Os fluctuate a lot (between 0 MB/s and 20 MB/s) |
| I/O Network | Approximately 3 MB/s | Between 20Mbps and 60Mbps. |
Conclusion
This test showed successful long running tests for more than 48h with an average of 1000 tx/s on a 4 node cluster GMS with external Cassandra 2.0.8. To scale on higher throughput, you should allow more nodes into the cluster.
In the testing environment, it was possible to have up to 2x better throughput but Cassandra could not sustain very long before getting late in compaction state, resulting in increase of latencies after a few hours load (4-8h).
The throughput tested in this scenario is about 2x maximum speed required (approximately 25 CAPS, approximately 400 tx/s expected).


