
Widget
A discrete portion of a user interface that provides a specific set of functionality.
Glossary
Dashboard
A user interface that, like an automobile dashboard, provides key decision-making information and/or controls in one easy-to-read display.
Glossary
Genesys Web Engagement Reporting Guide
Web Engagement tracks your customers' events and behaviors. Using Pulse, the Genesys reporting solution, you can set up a dashboard, as shown below, that helps you see the patterns in these events. (You can also still use CCPulse+.)
This dashboard contains widgets, which display a lot of useful information:

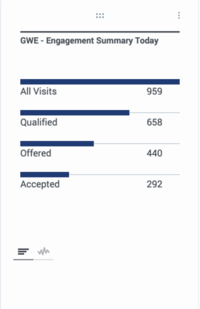
For example, you can see a summary of the day's engagements:
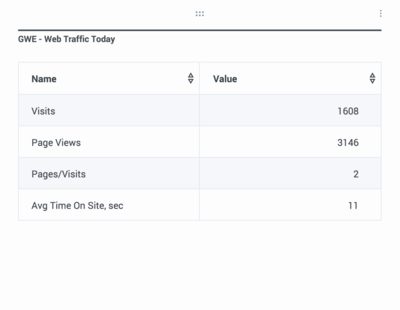
Or your daily traffic:
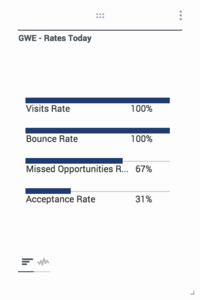
You can keep tabs on your bounce rate and acceptance rate, while staying in touch with how often you have missed engagement opportunities:
Selecting Your Data
You can choose which values to display. For example, you might want to see a few different values as a list:

Or you might want to view one or more of them separately:


Choosing Your Format
While some values call for a list or a bar chart, others might work best with a donut:


And some types of information work well as trend lines:


Basic Views and Extended Views
The features described on this page are available to the following Basic View widgets, each of which is described on its own page:
- GWE - Engagement Summary Today Basic View
- GWE - Web Traffic Today Basic View
- GWE - Visit Metrics
- GWE - Authenticated Visitors Today
- GWE - New vs. Returning Today
- GWE - Rates Today
You can also expand the Engagement Summary and Web Traffic Today widgets into Extended View dashboards.