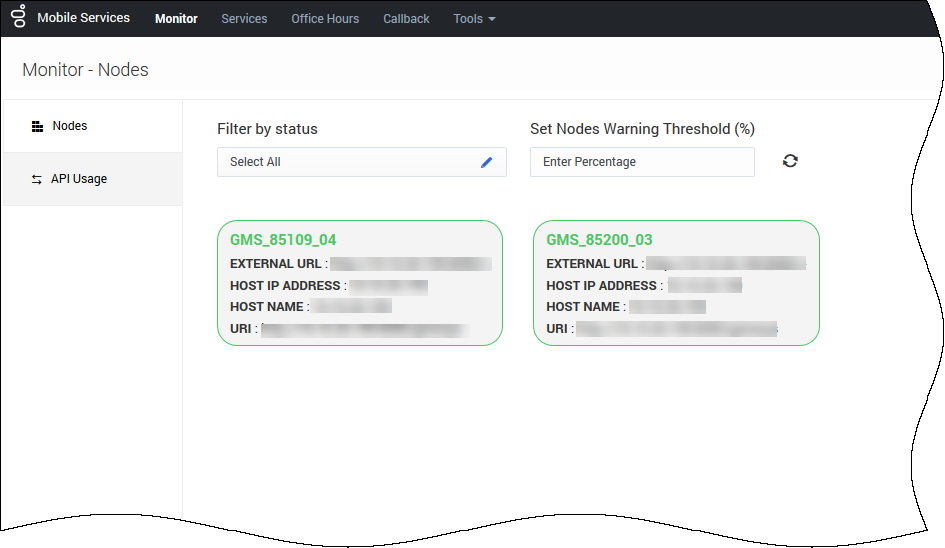
Monitor Tab
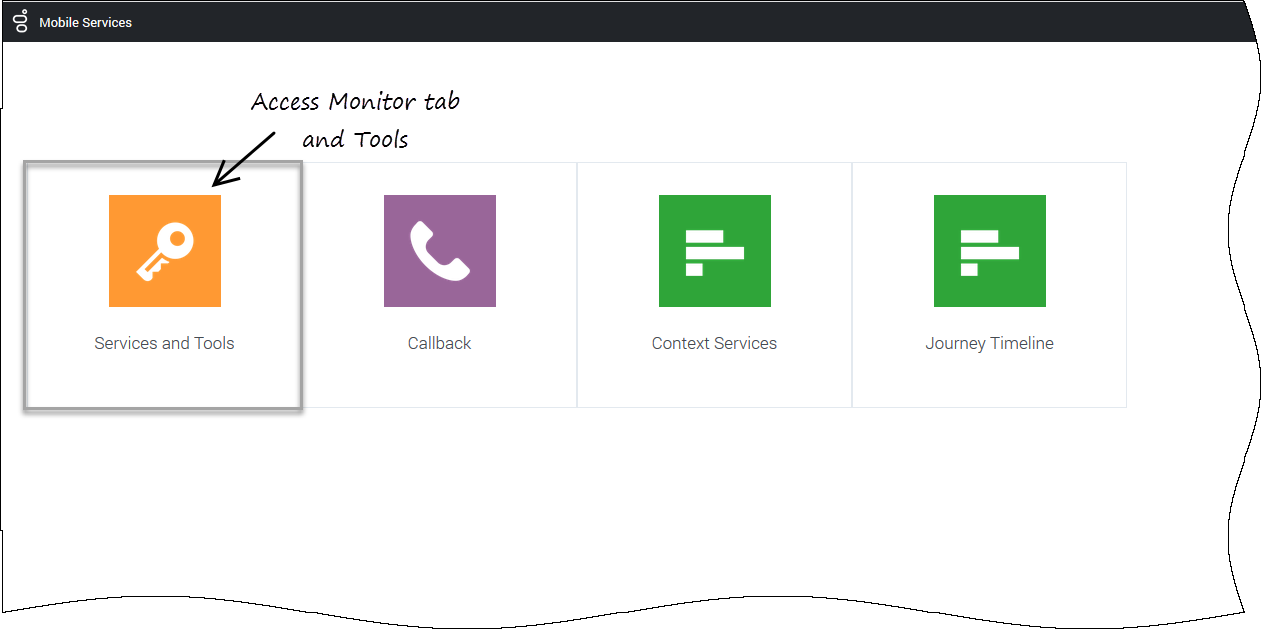
Access Monitor Tab
To access this interface, you must log in as a user who owns the Administrator or Supervisor role. Then, you can select the Admin UI icon.
Important
To make sure that the UI displays the right data of the GMS nodes, you need to consider some use cases and configuration options in your GMS application. See the options reference for details.Monitor tab
This page was last edited on April 11, 2018, at 20:00.
Comments or questions about this documentation? Contact us for support!


