Introducing Pulse
Genesys Pulse is a widget-driven, graphical user application, which is accessible from a web browser as a Genesys Administrator Extension (GAX) plug-in application. Using a direct communication link to a real-time metrics engine, Stat Server, Genesys Pulse enables at-a-glance views of real-time contact center statistics within the GAX user interface.
The tabs below provide a quick visual representation of some of the Pulse functionality and a list of the Genesys-provided templates. For more details, see the Pulse User's Guide.
Pulse Dashboard Examples
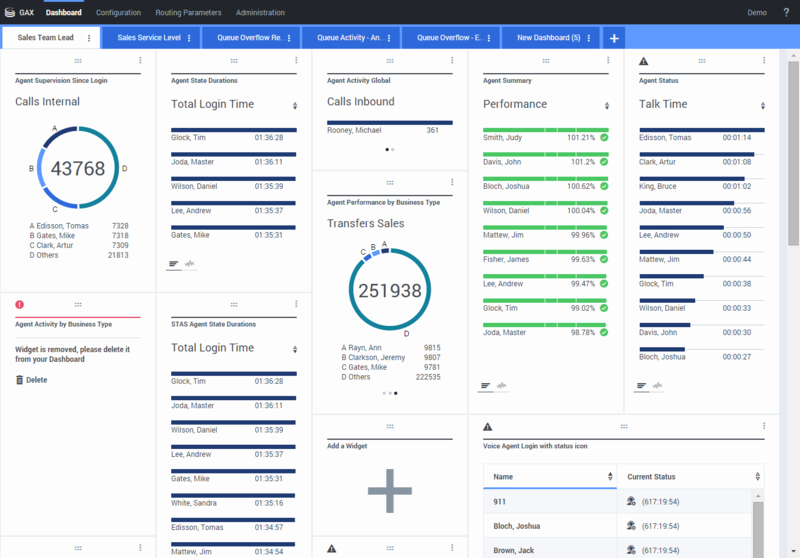
Examples of a Sales Team Lead dashboard
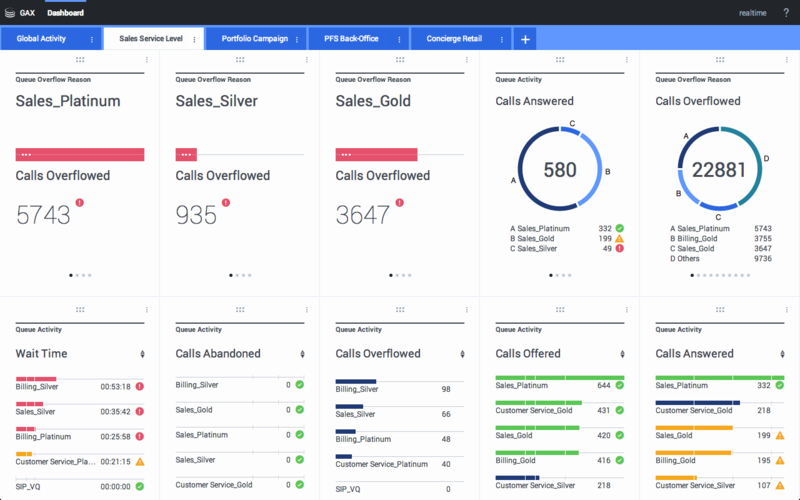
Example of a Sales Service Level dashboard for Supervisor
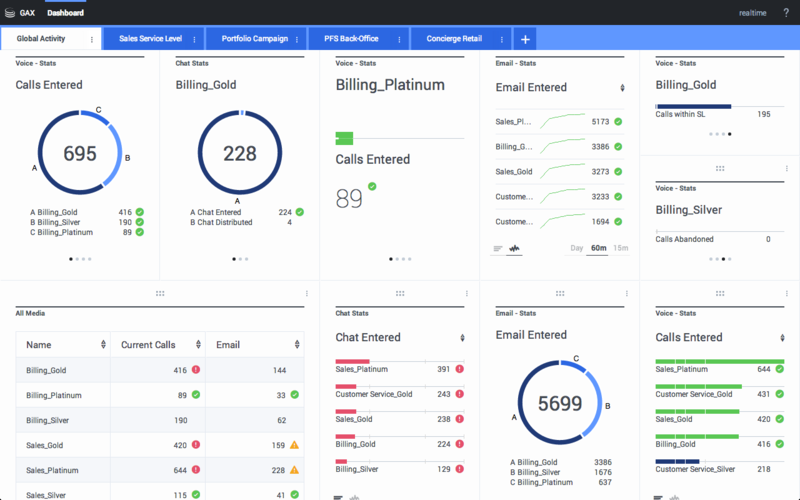
Example of a multi-channel dashboard for Supervisor
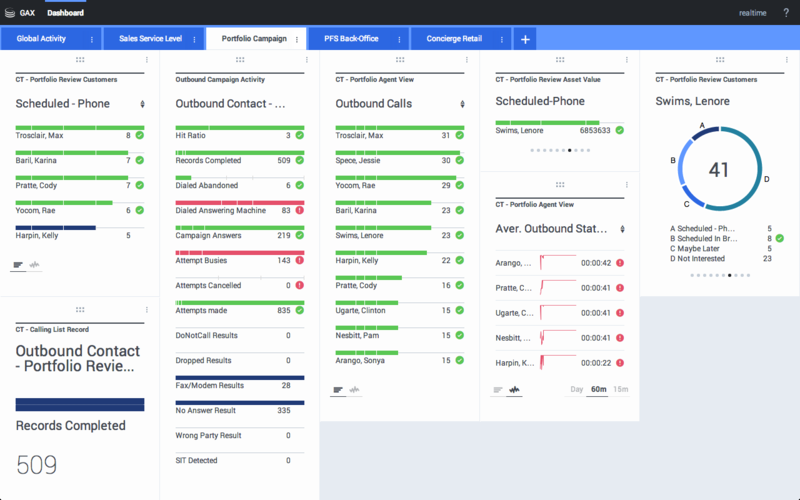
Example of an outbound campaign dashboard for Supervisor
Example of a back-office dashboard for Supervisor
Expanded Charts
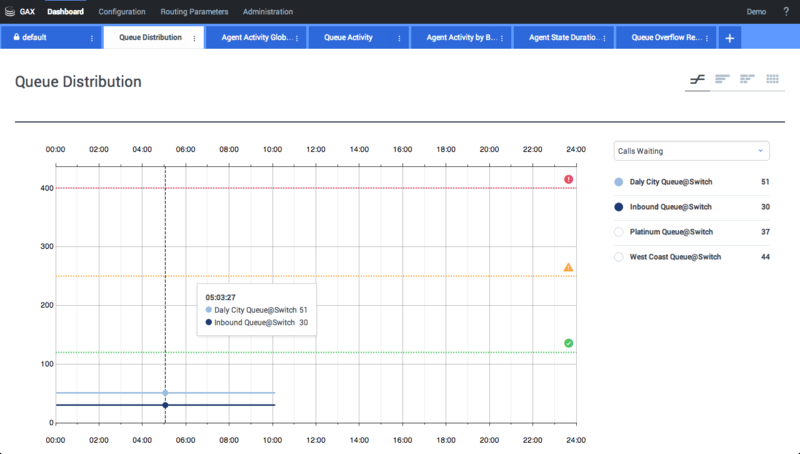
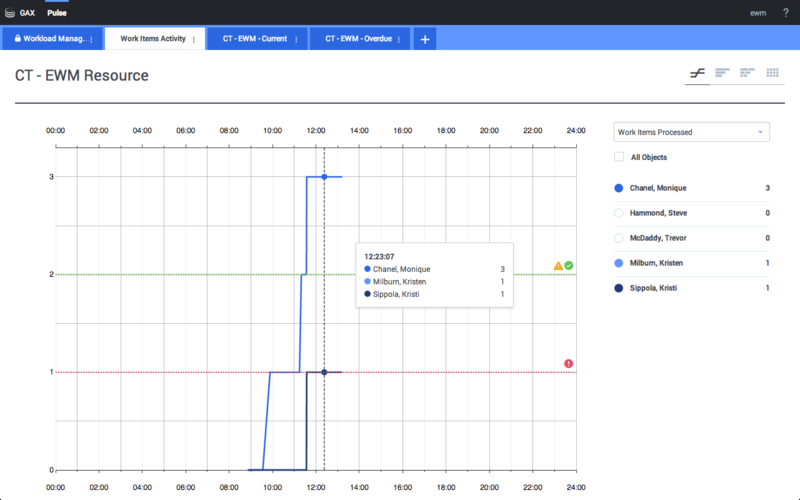
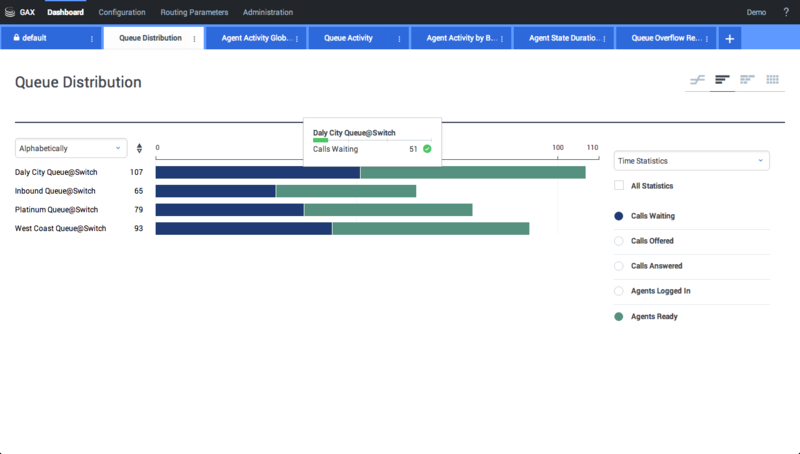
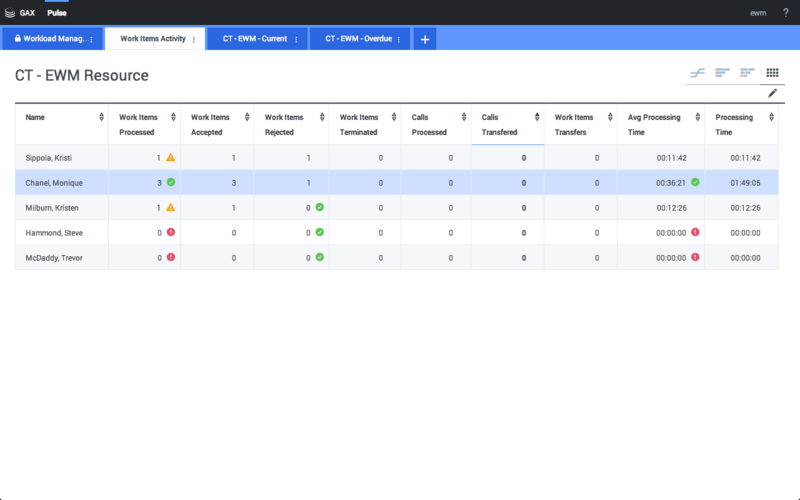
You can expand a widget to view detailed charts: Line; Grouped Bar; Stacked Bar; and Grid. Within the expanded charts, you can use sort options, define objects, and define statistics.
Line Chart
Grouped Bar Chart
Stacked Bar Chart
Grid
Widgets
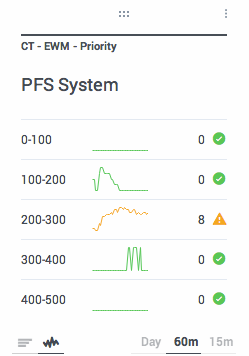
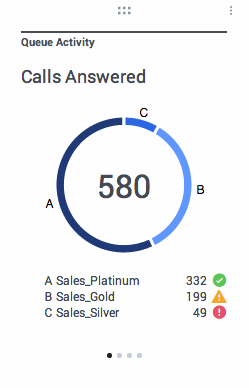
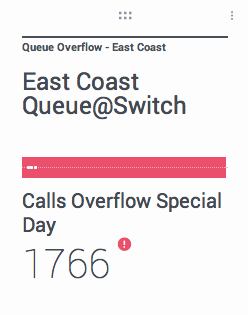
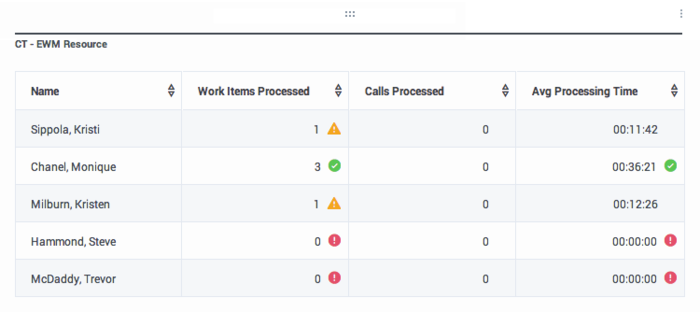
On the Pulse dashboard, statistics and objects can be displayed within different type of user-defined widgets: Donut; Grid; Key Performance Indicator (KPI); and List. You can view and select additional details and options by expanding a widget to a dashboard tab.
| Widget | Examples | |
|---|---|---|
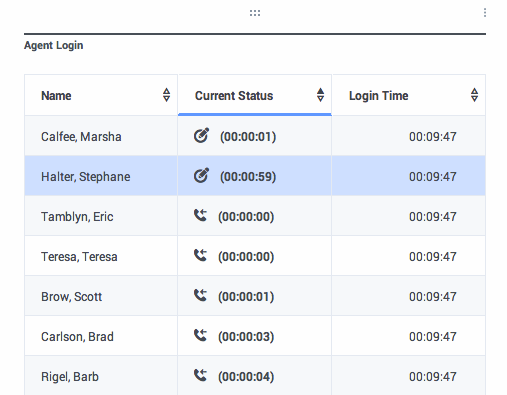
List Widget This widget displays either one statistic for many objects or many statistics for one object. Depending on the reference selected, the Headline type option might be available for this widget type. |
||
Donut Widget This widget displays either:
Depending on the reference selected in the Cycle By option, a carousel can be defined to display additional several items. |
||
KPI widget This widget displays either one statistic for several objects or several statistics for one object, depending on the value of the Cycle By option. The Cycle By option is available if the widget has objects selected individually, not by group. |
||
Grid widget This widget displays a grid listing objects in rows with statistics in columns. |
||
Genesys-provided Templates
The following is a list of Genesys-provided templates:
| Template | Description |
|---|---|
| Agent Group Status | Presents the current number of agents in the various states. |
| Agent KPIs | Presents reports with KPIs of agent group in a contact center. |
| Agent Login | Presents an agent's properties and login information. |
| Campaign Activity | Monitors the activity associated with outbound campaigns. |
| Campaign Callback Status | A report presenting information related to campaign initiated callbacks. |
| Campaign Group Activity | Monitor the activity associated with outbound Campaign Groups. |
| Campaign Group Status | Monitor the current state and durations associated with outbound campaign group activity. |
| Email Agent Activity | A report presenting agent or agent group activity as it relates to the processing of Email type contacts. |
| Email Queue Activity | A queue report presenting an overview of current or near real-time activity in the individual email queues. |
| eServices Agent Activity | Monitors agent group KPIs related to eServices (chat, email, SM) media to monitor and see if behavior problems exist that need to be addressed. |
| eServices Queue KPIs | A queue report presenting an overview of current or near real-time activity for eServices channels. |
| IWD Agent Activity | A report presenting agent or agent group activity as it relates to the processing iWD work items type contacts. |
| IWD Queue Activity | A queue report presenting an overview of current or near real-time activity associated with the iWD queues. |
| Queue KPIs | Presents call activity statistics associated with the queues. |
| Queue Overflow Reason | Presents reasons why calls were cleared from queues. |

