Contents
Getting Started
You can customize your Frontline Advisor dashboard to show the status, performance, behavioral- or activity-based data that matters most to you. Depending on your role, either you or a system administrator will configure business rules that monitor key performance indicators. You will then receive notifications of situations that require immediate attention.
Having access to real-time data and alerts means that you can continuously work with agents to correct problems and reinforce progress as it happens, rather than waiting for the next break, the next shift, or the end-of-week performance summary.
This Getting Started page will get you logged in with the correct language preferences, and familiarize you with the basic dashboard layout and general navigation features. Let’s get started.
Get to Know the Frontline Advisor Dashboard
The Frontline Advisor dashboard has three panes:
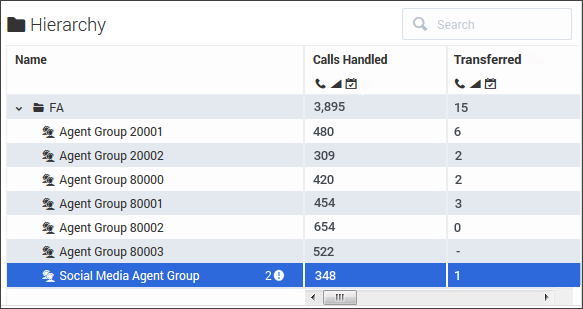
| 1. Hierarchy pane | The Hierarchy pane is a top-level, summary-type view of groups and agent teams that you monitor. |
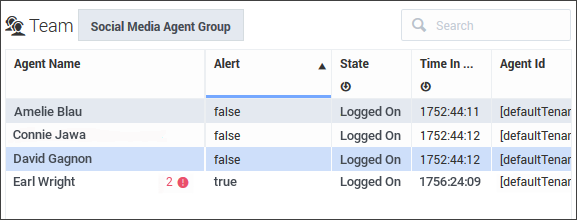
| 2. Team pane | The Team pane provides detailed information about the agent team that you selected in the Hierarchy pane. |
| 3. Team Alerts pane | The Team Alerts pane provides information about all of the rule-related alerts that are currently active on the agent team that is selected in the Hierarchy pane. |
All panes provide information in a table format (that is, rows and columns). The column headings use metric names. You might use the term statistic or Key Performance Indicator (KPI) in your Contact Center, rather than "metric", but you are no doubt familiar with performance-tracking data and the importance it plays in maintaining an efficient and effective contact center. Each metric measures and tracks a specific aspect of agent and/or group performance. The performance metrics are tied to larger business goals and targets. Metrics data that is collected at the level of individual agents is aggregated to become metrics data for teams, and so on for the entire enterprise. The management team uses this collection of metrics data to assess the enterprise's successes and failures and to determine where it stands in terms of specific short- and long-term goals.
The following sections describe each pane:
Hierarchy Pane
The monitoring hierarchy pane in your Frontline Advisor dashboard provides a summary of activity associated with the agent teams that you manage. The monitoring hierarchy is a representation of your enterprise; more specifically, it is a representation of the people in your enterprise who handle customer interactions.
You cannot modify the structure of the hierarchy from within the Frontline Advisor dashboard. The organization of the hierarchy, as well as any security permissions that control which parts of the hierarchy you can view, are managed separately.
It is called a hierarchy because it displays groups of people in a top-down view. As you work your way down through the hierarchy, you see a more granular group level until you are at the level of agent teams. For example, at the top level of the hierarchy you might see department names—Sales, or Customer Care. This top-level group typically contains other groups, although that is not a requirement. Let's assume that there are additional groups within each department. For example, there might be two groups within the Sales group—SmartPhones and Tablets. Within each of those groups are the teams of agents that deal with each specific product. For example, the agent teams that comprise SmartPhones might be Brand A, Brand B, and Brand C.
Team Pane
The Team pane is where you focus on each agent's overall status in real time. The Team pane displays data only when you select a team in the Hierarchy pane.
The data includes the names of the agents who are part of the selected team, and indicates the agents who are generating alerts, as well as the types of alerts that are currently active.
If the Agent Name column is available on your Team pane, then you will see the agents listed either by full name, by email address, or by user name. Your management team decides how users will be identified in the dashboards. By default, agents who are logged in to the system appear first in the Team pane, sorted alphabetically by last name (if agents' full names are used). Agents who are currently logged off are at the bottom of the list.
It is possible to change the order in which data displays in the pane. Click a column heading to sort the data based on that column, in ascending or descending order. For example, if your dashboard displays agents' full names, and you have access to the Agent Name column, then you can click the Agent Name heading to sort the list of agents alphabetically by last name. For more information, see Can I change the order in which data displays in the panes?
Using default settings, Frontline Advisor refreshes information in the Team pane every 10 seconds for state-related data (for example, Not Ready) and every 10 minutes for performance-related data (for example, Calls Handled). The refresh rate is configurable; you might have sufficient security permissions to specify dashboard refresh rates, or that configuration might be performed by system administrators.
Every agent's call statistics continue to accumulate until the relevant time period ends even though one or more agents might log off during the time period. Threshold violations are cleared as soon as the agent logs off.
Team Alerts Pane
Information about a team’s rule violations displays in the Team Alerts pane. You see data in this pane only when there is at least one rule violation for the team that you have selected in the Hierarchy pane.
You can find the following information about rule-related alerts in this pane:
- the identity of agents who are generating the rule-related alerts
- a description of the specific rule violation, if that information has been configured for your dashboard
- the time at which the alert was generated
By default, data in the Team Alerts pane is listed by alert time (the most recent alert is first in the list). However, if you select an agent in the Team pane, then any alerts associated with that agent move to the top of the list in the Team Alerts pane. You can also click column headings in the Team Alerts pane to change the order in which data displays. For example, if your dashboard displays agents' full names, then you can click the Agent Name column heading to sort the list of agents alphabetically by last name, in ascending or descending order. For more information, see Can I change the order in which data displays in the panes?
Click the pencil icon (![]() ) beside an alert to add a note. For example, you might describe how you handled that particular violation. Once you save the note, it displays in the row with the violation. You cannot edit or delete the note after it is saved. The note becomes part of the recorded history of the agent.
) beside an alert to add a note. For example, you might describe how you handled that particular violation. Once you save the note, it displays in the row with the violation. You cannot edit or delete the note after it is saved. The note becomes part of the recorded history of the agent.
Only alerts associated with business rules display in the Team Alerts pane. If agents are generating only threshold-related alerts, then the Team Alerts pane will be empty.
For more information, see Understanding Alerts.
Select Language Settings for Your Dashboard
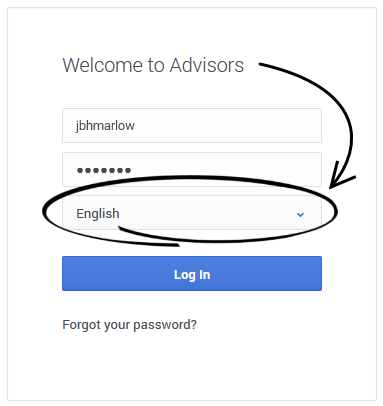
You specify your language preference on the Advisors login screen. The Advisors modules display text in the language you select on this screen. The list of available languages is dependent on the release of Pulse Advisors that is used in your Contact Center.
Change Personal Settings or Log Out
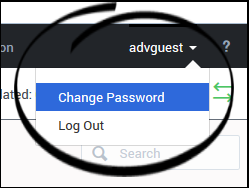
When you are logged into Frontline Advisor, you can use the drop-down list that is available under your username in the dashboard's toolbar to change personal settings, if applicable, or to log out of the Advisors modules. The options available to you in the drop-down list are dependent on the security permissions assigned to your role. For example, if you do not have permission to change your login password, then the Change Password option is not available in your drop-down list.
Role-based Access
Every person in a Contact Center who has at least some interaction with customers will be assigned to a role. For example, agent and supervisor are roles. Those roles control access to many elements of software, including the following:
- Advisors modules
- Various parts of the Advisors dashboards; for example, the dashboard panes and the metrics and alerts that display in those panes
- Nodes (groups) in the Hierarchy pane
Because of these role assignments, your dashboard might look a little different than the sample dashboards shown in this Help, and you might not have access to everything that is described in this document.
Depending on your role in the Contact Center, you might have access to only Frontline Advisor, or you might have access to additional Advisors dashboards. Use the Advisors navigation bar to open your Frontline Advisor dashboard.
Many of the Frontline Advisor dashboard settings are saved and stored immediately, as you make changes. For example, let's say that you increased the width of the Team Alerts pane, and then accidentally closed the browser (without logging out). When you open the browser and the Frontline Advisor dashboard again, the Team Alerts pane will have retained the width that you set before accidentally closing the browser.
| 1. Available Applications | On the navigation bar, you see links to the Advisors applications that you use. If you typically use Genesys Pulse, as well as Advisors applications, then your system administrator might also include a quick link to the Pulse application in the Advisors navigation bar. A line over an application name indicates the active dashboard. Click an application name on the navigation bar to open the associated dashboard. You can open two or more Advisors dashboard sessions simultaneously, however Genesys recommends that you use one type of web browser when working with Advisors. See also Is it okay to open multiple Frontline Advisor dashboard sessions? |
| 2. Help Topics (quick access to this document) | To open this document from the Advisors dashboards, click the question mark that displays in the top-right corner of the navigation bar. If you are not logged in to the Advisors dashboards, you can also access this document on the Genesys documentation site. |


