Working with FA Metrics Thresholds
The Thresholds tab on the Genesys Frontline Advisor (FA) administration page enables you to define the critical and acceptable conditions for the metrics to which you have been granted role-based access.
Because an agent can belong to multiple agent groups, it is possible in Frontline Advisor to define a threshold in different ways, and according to different overrides, for groups of which the agent is a member. In this case, the threshold violation level can display differently, depending on the path you use to navigate to the agent in the FA dashboard. For example, the AHT metric may have a red alert when the agent is viewed as a member of the Sales group, but only yellow when the agent is viewed as a member of the Services group. Rules can also have different definitions for the same agent based on the path chosen through the hierarchy to reach that agent. Only rule violations for the selected path are shown.
<tabber>
About=
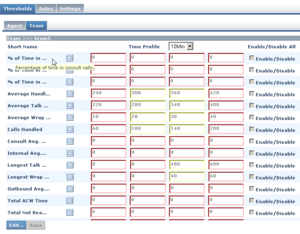
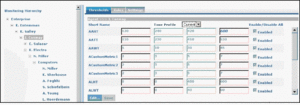
You must select a hierarchy node in the monitoring hierarchy navigator to display data in the Thresholds tab. The screenshot on the left shows an example of the Thresholds tab with the Team tab selected. Click the image to enlarge it.
Threshold Types
You can configure four types of thresholds. Depending on the metric, a value may be acceptable above or below a certain value. When thresholds are triggered, they highlight cells in Frontline Advisor or Agent Advisor. The four text boxes on the Thresholds tab are colored to provide a visual cue for the status.
The red text boxes are mandatory, while the yellow text box is optional (and may be replaced by a red text box). The text box colors change depending on the values you type. Enabled thresholds trigger a violation on the dashboard if a value is above or below defined values.
Red indicates a critical value range. Yellow indicates a warning value range. The following table describes how threshold alerts occur.
| If value is … | Value 1 … | And … | Value 2 … | Result |
|---|---|---|---|---|
| greater than | the value in the 4th text box | then the value is critical high (red) | ||
| greater than | the value in the 3rd text box | and less than or equal to | the value in the 4th text box | then the value is warning high (yellow) |
| greater than or equal to | the value in the 2nd text box | and less than or equal to | the value in the 3rd text box | then the value is acceptable (no color is displayed) |
| greater than or equal to | the value in the 1st text box | and less than | the value in the 2nd text box | then the value is warning low (yellow) |
| Less than | the value in the 1st text box | then the value is critical low (red) |
For the purposes of these examples, the system setting for how often the metrics are calculated (that is, the performance calculation interval) is 10 minutes.
Example 1
For an average of three-minute calls, handling two or more calls but less than or equal to five calls is acceptable. Handling one call is yellow. Handling less than one call is red. Handling more than five calls but less than or equal to eight calls (that is, the calls are too short) is yellow. And handling more than eight calls (that is, short-calling) is red. The following screenshot shows how to configure this scenario on the Thresholds tab.
Example 2
In this example, handling two or more calls but less than or equal to five calls is acceptable. Handling one call triggers a warning (yellow). Handling less than one call or more than five calls is a critical (red) violation.
Example 3
In this example, handling one or more calls but less than or equal to five calls is acceptable. Handling more than five calls, but less than or equal to eight calls triggers a warning (yellow). Handling less than one call or more than eight calls is a critical (red) violation.
|-| How To ...=
Purpose
To view threshold values in a level of the monitoring hierarchy.
Procedure
- Select the Thresholds tab.
The thresholds are displayed based on the last selected level. - Select a level in the Monitoring Hierarchy navigator.
The thresholds for the selected level are displayed in the pane on the right, subject to your access permissions. The name of the selected level displays in the title bar.
Purpose
To disable or override all thresholds at the selected node at once (subject to your access permissions).
Procedure
- Select the Thresholds tab.
- Select a level in the Monitoring Hierarchy navigator.
The thresholds for the selected level are displayed in the pane on the right, subject to your access permissions. - Click the Edit button at the bottom of the pane.
- Select the Enable/Disable All check box.
- Click Save or Cancel.
Purpose
To specify values for thresholds. Default values for thresholds are provided on installation; however, you can override them at any level, subject to your access permissions. To distinguish between the default values and overridden values, overridden values display in boldface and are italicized. Inherited values are in regular font. You can display the default value in a tooltip by moving the mouse cursor over an edited value.
For a group or agent, the state of thresholds at new nodes is inherited from the parent node. This includes whether the threshold is enabled or disabled.
Procedure
- Select the Thresholds tab.
The thresholds for the last selected level are displayed. - To define thresholds, select a level in the Monitoring Hierarchy navigator.
The thresholds and the title bar for the selected level display.
If you change any text field or check box and then select a new level, all changes for the previous level are discarded. - Click Edit.
The fields and Save button enable. The Edit button changes to a Cancel button. - Type new values in one or more text boxes.
The values must increment (or remain the same) from left to right. Non-negative integer numbers are allowed. No letters or blank spaces are allowed. If an invalid value is entered, an alert message box displays when the Save button is pressed. - To activate the threshold, check the Enabled checkbox.
To deactivate the threshold, clear the Enabled checkbox. - (Optional) To reset the threshold attributes to the previously inherited values, click the Reset checkbox that displays next to the threshold row after you override one of the thresholds attributes.
The Reset checkbox disappears after you click Save.
The Reset All link performs the reset operation to all overridden thresholds. - Do one of the following to complete the configuration:
- To discard any changes made and revert the contents of the Thresholds tab to the last values saved to the database, click Cancel.
- To save all of the changes to the thresholds, click Save.
A confirmation message displays. If any errors are detected through validation, an alert message displays.
You want to store an override value of 600 at the node that Conway monitors, that is, the Computers node. To enter an override value, click the Edit button to enter the edit mode. Type a value of 600 for Critical High AHT, and click the Save button. The override value of 600 now displays at the Conway (Computers) node in italic font, and a slightly larger font than the other (inherited) values.
From now on, if nothing else changes, the Conway/Computers node and all nodes in that subtree (which do not have an override value) will inherit a value of 600 for critical high AHT.


