Event Correlation
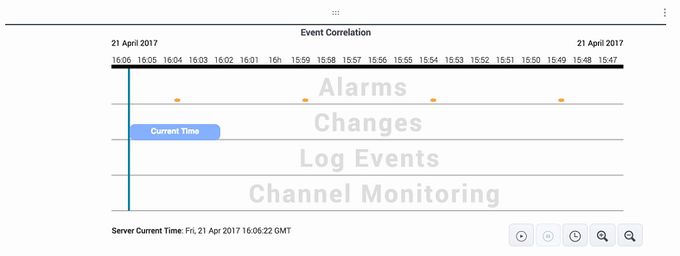
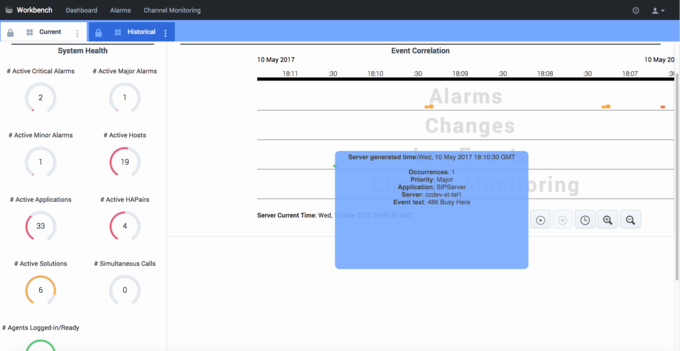
The Event Correlation widget displays events from multiple data sources on a single display with one timeline, for easy correlation. The data is displayed in the dashboard as soon as it is available from its source.
Event Correlation Widget
To stay current, the display scrolls to the right in real time as time passes and events arrive. The vertical blue line on the correlation display indicates the current time.
Event Correlation Widget
Further navigation is possible in the Event Correlation widget using the control buttons at the bottom right of the widget:
- Place the cursor over the widget display area, and the display scrolling pauses, allowing you to hover or select/click on a particular event
- ”Grab” the display and drag it left or right to see events in an adjacent time period
- Click the pause button at the lower right of the widget to pause the scrolling. Then click the plus or minus button to adjust the zoom so you can see a different time segment on the screen. When you’re done investigating, click the play button to resume the display scrolling in real time.
Each event, or group of events, reported by Workbench on the Event Correlation widget is represented by a colored dot. You can get more information about an event in several ways:
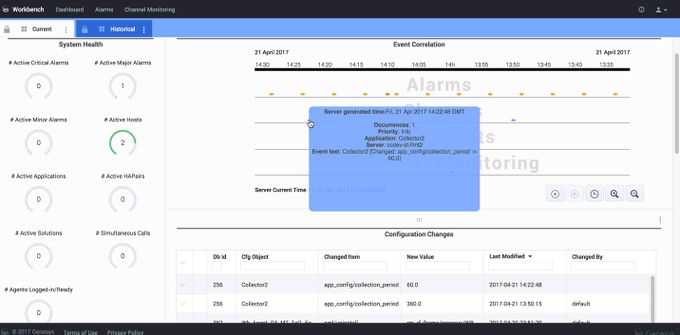
- Hover the mouse over an event dot to see summary information.
- If the dot represents a single event, a summary of the event text is displayed in the hover text.
- If the dot represents multiple events, only a count of how many events are included is displayed in the hover text.
Hovering Over an Event in (Configuration) Changes
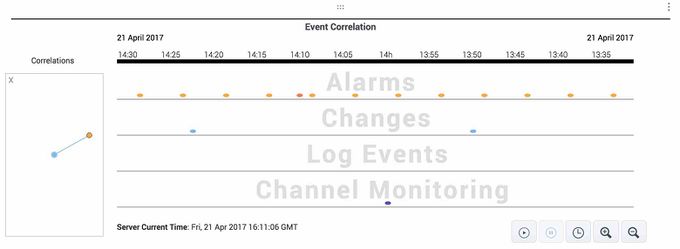
- Single click on the event to see a Correlations pop-up diagram that indicates other events which might be correlated to the selected event. This pop-up only appears if there are correlated events to display. Otherwise, the hover text “No Correlated Events” will be displayed.
Single Click on an Event displays a Correlations pop-up
- Double-click to open an additional "widget" with detailed information about the event selected. The details widget type will vary based on the type of event selected (Alarms, Changes, Log Events, or Channel Monitoring). Select the Alarms, Changes, Log Events, or Channel Monitoring tab on this page for additional information on these event types and the associated widgets.
You can also double-click on a "dot" (event) in either the main Event Correlation widget display or the small Correlations pop-up graphic. The details widget is displayed.
Double-Click on a Dot (Event) in the Correlations pop-up to the left or in the Event Correlation
Alarms data
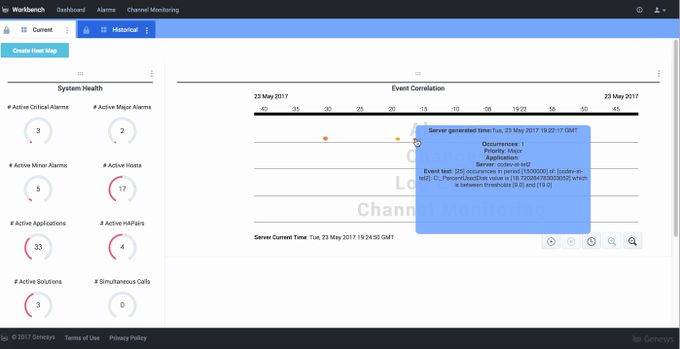
In the Event Correlation widget, you can hover and drill down on an event in the Alarms data row. The details "widget" appears when you double-click on an alarm event. It displays various properties of the alarms including priority, status, and arrival time. In addition to showing details in bold for the selected event, the details widget also shows information about surrounding alarm events to give additional context.
Hovering over an Alarm in the Alarms row
Details that appear when double-clicking an Alarm
Configuration Changes data
In the Event Correlation widget, you can hover and drill down on an event in the Changes data row. The details "widget" appears when you double-click on a configuration change event. Various properties of the configuration changes will display including the object changed, the new value and the user who made the change. In addition to showing details for the event selected, this details widget also shows information about surrounding change events to give additional context.
Hovering over a Configuration Change in the Changes row
You can filter by Changed Item and other fields to see previous changes and values for a particular option (see below for an example).
Details that appear when double-clicking a Changes event
Log Events data
Log events collected by the Workbench Log Extractor appear on the Log Events row in Event Correlation widget. Hover on a dot in the Log Events row to see high-level information about that event.
Hovering on a Log Event
When you double-click on a dot in the Log Events row of the Event Correlation widget, the Log Analysis console opens in a new browser tab, and it displays the corresponding log file and highlights the details about that log event in red.
The Log Analysis console allows you to see other events surrounding this log event in the log file, and perform additional log analysis. For additional information on this view, please see the Log Analysis section in this guide.
Double-click to view Log Analysis (with details for that log event in red)
Supported Genesys Application Logs
The following Genesys application logs are currently supported in the Log Events row of the Event Correlation widget:
- SIP Server component
- T-Server components (for 8.1 supported T-Servers)
- GVP Components:
- CCP (Call Control Platform)
- CTIC (CTI Connector)
- MCP (Media Control Platform)
- PSTN connector
- Resource Manager
Events that are tracked and displayed in the Log Events row of the Event Correlation dialog include the following general errors from all supported components:
- 404 Not Found
- 405 Method Not Allowed
- 480 Service Unavailable
- 500 Server Internal error
- And most other 400 & 500 range errors
Additionally, some specific errors from certain components are also captured and displayed as a Log Event.
- Resource Manager
- Unable to find physical resource for servicetype
- RequestResource failed
- Unable to allocate source resource %s
- Media Control Platform
- POST request failed due to unsupported URL
- <event name="msml.conf.recording.failure" id=”*”/>
- CTI Connector
- Error: TMOperationNetworkDisconnect
- Error: text="Result=FAILURE&reason=FeatureNotSupported"
This list of supported application logs and events will evolve over time with subsequent Workbench releases.
Channel Monitoring Data
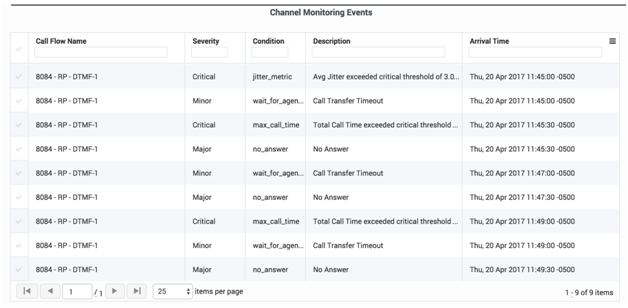
The Channel Monitoring event details table allows you to see details for alerts and events displayed in the Channel Monitoring row of the event correlation dashboard.
Channel Monitoring Events Detail Table
The Channel Monitoring Events details table shows the alerts triggered on each Call Flow. Each row includes the following information:
- Call Flow Name – the name of the call flow associated with the test call event
- Severity – indicates whether this Channel Monitoring event was configured as Critical, Major or Minor for this call flow
- Condition –the condition that caused the alert
- Description – a description of the test call alert
- Arrival Time – the time when the event was captured
An explanation of each alert type is provided in the Channel Monitoring section.

